
About Bucky Stats

A Data Hub For Open Source Intelligence
Bucky Stats was built to answer countless questions that were previously tough to ask. Thus far, it is a weekend project by Morgan Lesko — a little gift for society's sense-making and sense-making societies.
It has begun with datasets most relevant to my own geography and recent decision-making. But with some software infrastructure in place, I plan to keep gradually expanding all the scopes of this website.
This open source project is not for profit and will continue to be free for all. This website does not advertise, nor share nor sell any visitor data. But if you've found significant value here, donations are warmly welcome.
Many institutions have impressive databases online. Some institutions built impressive data presentation tools in 2020. But I found it challenging to find the more actionable data points that I really wanted to see.
Too many of the tools built for laypeople in 2020 also focused on very small timescales which often have a natural bias to fuel alarm. But with historically unprecedented social contracts on the table, I can only make informed decisions with significant historical context.
By my standards, the best data provided on this website represents the starting edge of more actionable trend analysis to understand our collective situation. I think such first, second, and third-level data calculations would be part of the required reading for conscious participation in representative governance. Bucky Stats provides some of the dashboards I would desire to make informed decisions.
Epidemiology is the branch of medical science that investigates diseases, disorders, and how they relate to society. When comparing health data between populations, more actionable analysis requires accounting for relevant demographic differences.
For example, about 6.7% of Maryland is at least 75 years old. But about 9.6% of Florida is at least 75 years old. So beyond scaling all-cause mortality data to the total size of a population (percent or "per million"), we can get even more comparable datasets by converting each state's data to a standardized population distribution. Each graph that includes these population distributions includes sample calculations that help explain the methods used here.
In my current judgment, standardizing populations by age group distribution provides somewhat more actionable and responsible comparisons between jurisdictions. This is better than the raw numbers, but should also only be the beginning, as we determine other significant variables impacting all the systems which are integral to our most important questions.
Because preexisting science on 2020 public health policies was far from overwhelming or unquestionable, we must compare different populations in retrospect. (Non-pharmaceutical public health measures for mitigating the risk and impact of epidemic and pandemic influenza, World Health Organization, November 2019: "The evidence base on the effectiveness of NPIs in community settings is limited, and the overall quality of evidence was very low for most interventions.")
In my personal experience of 2020, large governmental and media institutions rarely presented any data with enough analysis to make it worthy of any life-or-death decisions. Here is the national average alongside the 15 largest states:

About The Coder
In October 2020, I used OpenOffice spreadsheets to create a few graphs for a handful of states before the '20-'21 flu season. But it was very tedious, more vulnerable to my own human error, and not nearly as scalable as my favorite tools for the past 20 years: PHP, MySQL, HTML, JS, & CSS. This method also makes it much easier for me to periodically update data.
My work through this website should not be mistaken for rigorous, peer-reviewed, scientific inquiry. But I have tried my best to share data analysis that is as accurate as possible. Please contact me if your find any errors in the data or approach, or report bugs in the open source codebase. As more eyes review this website, it should become ever more accurate.
I only have a B.S. from the University of Maryland in
2005 for Computer Science with a concentration in Mathematics. But I am an activist and software engineer who wants collective decisions to
be more evidence-based.

Beyond web-based software, I have also been a life-long public health advocate, initially fighting big tobacco for most of the 1990s.
A year after first enjoying cannabis, and two weeks after 9/11, I was busted for one joint at the University of Maryland (UMD).
I was astonished by how much more harm the "War on Drugs" does than illicit drugs or drug users themselves. And I was astonished by how far a public health issue could stray into issues of basic human rights and cognitive liberty. So I founded the UMD chapter of Students for Sensible Drug Policy in 2002.
This Site Is for Data, My Opinions Don't Matter Here
In addition to obsessively studying the world, I believe I have some significant personal bias for skepticism of many public health positions or policies. Some multi-decade public health issues are further in the rearview, but we are still amongst other multi-decade tragedies in the name of alleged greater goods. Especially when rational debate is avoided in favor of "consensus" groupthink and/or censorship, I think histories and sciences prove "skeptics" are worth serious consideration.
It is my opinion that our data-saturated world is part of a fantastic curve of progress.
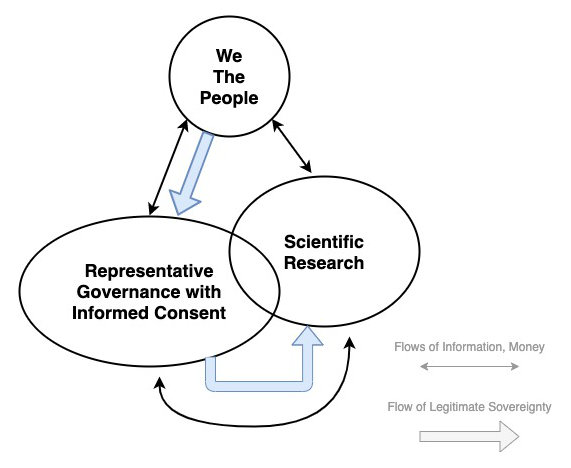
But We The People must provide informed consent to representative governments. And beyond that standard, I do not think it is legitimate to delegate authorities we do not have as individuals or smaller groups.
I believe the burden of proof usually lies with those restricting any natural, human, and/or constitutional rights of others.
It can be clearly 'right' or 'just' to use force in self-defense of direct physical harm. But beyond that, the burden of proof should be relatively high, and rests with those initiating the use or threat of physical violence. Threats of physical violence include jail, and fines which can result in jail. Without proof that doing violence is justified, the consent to the aggressor's authority will steadily dwindle.

If policy positions are held so strongly as to be considered
unquestionable, then it should be trivial to defend them. It should also be trivial to defend them in
intellectual debates which cite specific studies and data points, with context and uncertainty noted for all data. If policy positions cannot be defended in such ways, perhaps they are more political than scientific, and should be treated as such.
If our governmental decisions are allegedly too complex for voters to understand, then we cannot pretend like we know what might be "done in our names." There is some point at which the projects are too large to be trusted without informed oversight by we the people. Given preexisting incentives, continuing our current trends contains great social and ecological risk.
As scientifically-based current events grow in prominence, we need higher quality data analysis in order to judge our representatives' decisions. We also need thorough public debates on scientific issues — instead of censorship — but that is not the focus of this website.
My other essays and videos are radical by many standards, but I still prefer strong evidence for significant claims whenever possible. I welcome integrating new evidence.
Hopefully, this is by far the most subjective page on this website. The rest should remain a neutral public resource to improve the quality of complex discourse. Bucky Stats is a small hub for open source intelligence and evidence-based decision-making.

Donations and Support
Please Help Grow This Independent Open Intelligence Hub
First driven by curiosity on this project, I plan to continue adding more open source data lines to these
collections, gradually build dashboards to more effectively explore the
world's data.
Bucky Stats will gradually fold in wider geographies and metrics for more topics closest to my heart and mind. But please feel free to contact me to 'vote for' any high-quality datasets you find interesting — or additional calculations.
Perhaps my first couple hundred hours into this website have already saved you significant hours of research or software/spreadsheet development. If you're feeling grateful, generous, and financially comfortable, then any financial support is deeply appreciated.
If you've already found significant value in this website, your donations are warmly welcomed to encourage its continued maintenance and exploration.
Monthly Donation
One-Time Donation
with PayPal
